
COMMON QUESTION: “How does my practice compare to others?”
CONSULTANT’S ANSWER: “Is your net income 10% better than last year?”
COMMON RESPONSE: “My turnover is 6-8% better!”
CONSULTANT’S INQUIRY: “How much of that is true net?”
COMMON REPLY: “My Average Client Transaction is up!”
CONSULTANT’S INQUIRY: “What is the income per FTE staff member?”
COMMON REPLY: “I do not measure that!”
INQUIRY: “How many new clients are coming due to satisfied client referrals?”
COMMON REPLY: “I do not measure that!”
CONSULTANT’S INQUIRY: “Are you meeting the ROI in your budget?”
COMMON REPLY: “I do not plan for that! How is it set?”
FACTOID: “Balance Sheet assets @ share market return!”
CONSULTANT’S INQUIRY: “What is your fee compliance rates?”
COMMON REPLY: “I do not know how to measure that!”
FACTOID: “Using the AAHA or 2010 AVA paired veterinary Chart of Accounts, income to expense for each major line item should equal fee schedule rate!”
The above exchange is more common than you would think. Most have not yet developed a business sense in their practice operations. Ask Kroger, King Super, Jewel, or in Australia, Coles or Woolies, about ‘mince sales’; they can tell you which mince has the best sale rate, what it costs to produce each, and what the profit margin is on each mince line item. Meat market staff members sell mince at marked prices, NEVER discounting a line item arbitrarily or in secret. Inversely, many veterinarians seem to reduce hospitalization charges first when trying to make an invoice meet the quote/client expectation; arbitrary reduction of any invoice line item is THEFT and should be prosecuted, but that seldom happens.
| ADJUSTMENTS – NOT DISCOUNTS!
As a practice consultant, I believe in a “Good Samaritan” allowance for each provider, so I put it into the Program-based Budget. When used, it is entered at the bottom of an invoice as an ADJUSTMENT, never as a line item discount, which sets follow-up expectations in the client’s mind and angst to the next provider, as well as fracturing the internal controls of the practice management. If a provider exceeds their quarterly GS allowance, it is time for a one-on-one soul searching discussion with the Medical Director or Practice Owner.
FACTOID – if the practice team does not “meet budget” in any quarter, the first thing that is done is a one-on-one review of the written Standard of Cares of the practice with each provider; failure to meet budget = failure to keep to the SOC commitments previously made. The reason(s) must be identified immediately so corrections can be in healthcare delivery behavior(s)! |
When asked to compare a practice to others, reputable consultants do not attempt it. Demographics, catchment areas, staff profiles, and veterinarian or manager leadership styles are way too variable for a viable comparison. Then there are those that ask where the sit on the “bell curve” of similar staffed practices. The bell curve was invented by academics to allow blaming of students for “not learning” rather than accept accountability for education of the students, and accomplishing the learning that was in their contract as an educator. We are involved with quality healthcare delivery, and there is no “C” average for placing an I.V, – either you are in the vein or you are not! There is no “C” average for restoring an airway with an anesthetic misadventure (that is what surgeons call a patient that dies on the table) – either you restore breathing or you bury the patient. There is NO such thing as a partial pregnancy – it is all or nothing!
Competency = excellence = consistent quality!
This is where leadership becomes the FIRST consideration when addressing any practice variables, or practice comparisons. Leaders have followers, and in the progressive and profitable veterinary practice of today, that means proactive, team-based, healthcare delivery is the rule, not the exception. It means there is appropriate pricing when the well-care is delivered by staff members, freeing up the veterinarian to do the diagnosing, prescribing, and surgery.
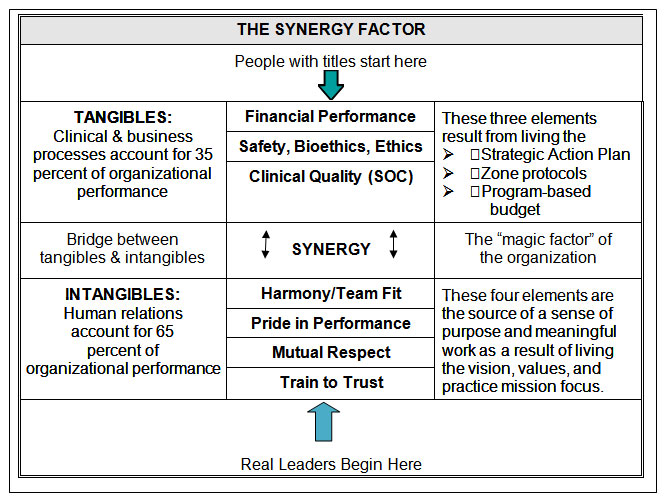
The Synergy Model below shows that the tangibles rest on the intangibles. The intangibles support the tangible gains. Without the synergy bridge (organization spirit), the four intangibles and three tangibles become just seven “observed” factors of a successful organization. Again, the neophytes center on the tangibles. They are easy to measure, and while most people who “know the words”, they do not really understand the dynamics, only addressing the intangibles at the time of crisis. The tangibles are very important, they are the fruit of dedicated people working hard to be the very best. It is the savvy leader who understands that quality fruit can only grow from healthy seeds, which represent the intangibles.
In the VCI Signature Series monograph, Models and Methods (available from the VIN Bookstore, www.vin.com), I made a simple observation – “new programs need new metrics”. If you use old metrics, the new program will usually revert to the old program style, and then frustration sets in for all involved. I will close this article, after the SYNERGY LEADERSHIP MODEL, with some examples of new metrics. These new KPI concepts are just an advance peek at my consulting information which I help you adapt the new metric concepts to your own practice.
SYNERGY LEADERSHIP MODEL
Reference: The Next Level Of Renewed Leadership, VCI Signature Series Monograph
The above model has been a long time coming to veterinary medicine. Current research by the American College of Healthcare Consultants shows that only 35% of a program success is affected by the tangibles, while 65% is impacted by the intangibles. Concurrent research in American white collar work environments show that “boss initiative” have a 30 percent success rate, while “staff-based initiatives” have an 80 percent success rate. It is the healthcare commitment of employees that gives practices a bit of an edge over the white collar workplace, but the differences are similar enough to understand the syndrome we are seeing. Doctor-centered practices are counterproductive for continued growth and quality of life to co-exist.
Consider the existing tangibles our profession uses for Financial Performance: models of the now defunct NCVEI, Veterinary Economics, AVMA/AAHA surveys and AVA/AVBA efforts in Australia. In most all cases, averages abound. An ‘average’ is simply “the best of the worst” or the “worst of the best”; in either case, it means striving for mediocrity of you use an ‘average’ as your yardstick. The Clinical Quality was most recently defined in the AAHA Compliance Study (2003 and again in 2006), a landmark survey showing the average doctor was missing a potential income of over $630,000 a year because of inconsistent delivery of wellness needs for the patients in their care. AAHA called there survey a ‘compliance study’, but any knowledgeable reader assessing the details understood immediately it was NOT client compliance, but rather, provider compliance; consistent Standards of Care within the practice’s healthcare delivery system(s).
| COMPLIANCE vs ADHERENCE
Compliance has been defined as what you can control within your own team and within your own practice. Adherence has been defined as that which the client does in response to the healthcare provider statement of needs. The Joint Commission has differentiated these two terms in human healthcare facilities across the United States |
NEW LOOK AT KEY PRACTICE INDICATORS (KPIs)
Now that we have your attention, let me ask you how many of the following factors are tracked monthly (or quarterly) in your practice for savvy leadership decisions and staff coaching efforts:
- Sales per FTE team member (quarterly is best)
- Consult Room Booking Rate (not doctor booking rate)
- # Assymerty Exams Recorded per # patient transactions
- Number of Abnormals with CR- recorded to # patient transactions
- # of patients with pre-emptive pain scores per 100 patient transactions
- SOC Compliance Rate (X-A-D or W recorded for each “need” [CR-__]); X = do it now; A = appointment made; D = deferred [until when?]; W = waived (no belief by client)
- Percent of patients leaving with at least 2 of the 4 Rs recorded (Recall, Revisit, Remind, and Resolved)
- Percent of patients with active pet insurance policies
- Percentage Revisits assigned to attending nurse/technician
- # patient transactions to # Ortolani/Penn Hipp => # of JPS
- Telephone Shopper Conversion Rate to Client Visit
- Percent of outpatients with Blood Pressure Recorded (e.g., PetMap)
- Number of questionable BP patients admitted or brought back evaluation
- Number of Training Hours made available
- Percent of patients with pre-emptive pain score in medical records
- V. TKO [IOF] vs Anesthesia rate
- Percentage of atypical pre-surg blood screens brought back for follow-up
- Rate of Post-anesthesia SMS Photo Sent per anesthetic procedures
- # of Dental Scores per # of patient transactions
- Dentals booked per patient transactions (85% is maximum predicted)
- # of Dental X-Ray procedures performed per other-than-zero dental grades
- # of BCS per # of patient transactions
- Non-5 Body Condition Scores (BCS) per patient transaction rate – 50% is maximum expected
- Non-5 BCS referred to nutritional advisor
- Return rate for nutritional advisor review of Non-5 BCS
- Number of FNAs
- Number of quarterly STT rechecks by attending nurse/technician
- Number of QOL calls made by staff (from internal doctor referral)
- Number of semi-annual well-care consults conducted
- Number of well-care consults with surveillance blood or urine screening
- Number of surveillance lab screens brought back for atypical evaluation
- Number of Family Fit Behavior Consults by nursing/technician staff
- Percent of patients fit with appropriate head collars
(http://www.youtube.com/watch?v=TWFPWj08Bhs)
- Percent of patients fit with thundershirts (thundershirt.com)
- Number of Accountability positions (see attached chart) still not filled
- Number of Accountability positions with back-up person trained
As you can see, there are many metrics not in routine use within our profession. As long as we continue to compare gross turnover dollars and the average client transaction dollars, as primary indicators, we are doomed to ignore liquidity and true net comparisons.


